
02 Mar 2023
Friends of the Earth has for many years bemoaned the lack of ambition to increase tree cover in the UK and has urged governments of all colours and at all levels to do more. More tree cover is needed for multiple reasons, as detailed in our 2022 report, "Why we need more trees in the UK".
Because of technological and data developments, it’s now possible to accurately measure and map current tree cover in England to extraordinary detail, albeit it’s a complex and gargantuan task (see a description of the methodology at the end of this article). Unfortunately, data isn’t yet available to do the same in the other UK nations.
Key findings on tree cover in England
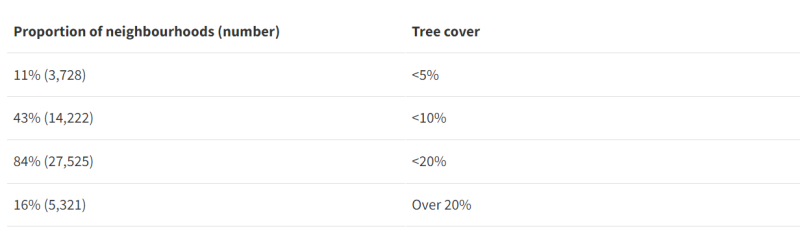
The data, which is summarised in the tables and graph below, enables tree cover comparisons between both local authority areas and neighbourhoods (defined by Lower Layer Super Output Areas).
It shows that 43% of neighbourhoods in England have less than 10% tree canopy cover, while 84% have less than 20% coverage. There’s a significant gap in tree numbers between the wealthiest neighbourhoods and those with the highest levels of social deprivation, with the poorest areas most likely to have fewer trees.
Tree cover vs deprivation by local authority

The UK government hasn’t set a target for neighbourhood tree cover, although it has set a target for England as a whole. This target is a paltry increase from the current 12.8% to 16.5%, whereas the average across the EU is 38% for woodlands alone (ie excluding lone trees, street trees etc).
However, the Urban Forestry and Woodland Advisory Committee Network, made up of tree experts, has recommended 20% as a good aspiration for neighbourhood tree cover, while the European Commission is recommending a minimum of 10% in urban areas within the European Union.
Natural England, the government’s nature agency, has promised to produce guidance on increasing urban tree cover in 2023. Friends of the Earth will be pushing to ensure this properly addresses inequalities in tree cover and recognises the critical role trees have in addressing nature loss, climate adaptation and mental wellbeing.
Local authority and neighbourhood tree cover rankings
Top 20 local authority areas for tree cover
Bottom 20 local authority areas for tree cover
Neighbourhood tree cover
See the full data sets for local authorities and neighbourhoods.
Methodology for mapping tree cover
Light Detection and Ranging (LiDAR) data has been used to find lost cities in the Amazon by seeing through gaps in the tree canopy. We’ve used the same kind of data, collected by the Environment Agency between 2016 and 2022, for every square metre of England to detect and map existing tree cover.
Using our own algorithm, we first identified areas of ground and buildings to be excluded for the purposes of tree identification. This was done for every square metre. A set of variables, including gradient, range and transparency, were then calculated for each location, using the height values for that square as well as neighbouring squares. The algorithm was trained on examples of known trees, and trees were identified from the patterns within these variables. Many of these training sets were used to cover the wide varieties of trees found in England. Hedges aren’t included in the classification, although trees in hedges are.
Once the algorithm was trained to identify trees, it was run on 5km-by-5km data tiles, each of which included 25 million sets of height values. Approximately 5,000 of these tiles, representing billions of data points, were run through the algorithm, producing a highly detailed tree map for the whole of England. Where the LiDAR data was unavailable, we substituted National Forest Inventory information as a proxy.
Identifying only trees and excluding buildings, buses, cars, lamp posts, pylons, wind turbines, bridges and so on isn’t easy, and there will be some misclassifications. Gantries over motorways and structures in oil refineries are surprisingly tree-like. We’ve actively tried to exclude these objects, but some may inevitably remain.
Some existing trees will be missing from the map. These include trees that have grown above the minimum height threshold in the last few years.
Conversely, some trees will be on the map that no longer exist. These may have been cut down or lost in recent storms.
The national treescape changes slowly but is dynamic. Commercial plantations grow slowly but are harvested quickly, with clear cutting for timber, to clear storm damage or to control disease.
The map represents a historic snapshot in time when most ash trees are sadly dying from disease but new woodlands are being created to capture carbon and create habitat.
Friends of the Earth tree mapping compared to other approaches.
TerraSulis have compared the approach they took to tree mapping with other approaches - Copernicus (DLT) and CEH Land Cover, both of which are Sentinel-2 satellite classifications with 10m x 10m pixels (100 m2). Our mapping uses Environment Agency LIDAR data with 1m pixels resolution (1m2).
Neither DLT nor CHE can directly sense the height of the canopy and consequently will include some 'woodland' areas that are shorter than the 3m vertical threshold we use. The DLT and CHE data are therefore likely to over-estimate tree cover somewhat because they may capture stands of shrubs, including Rhododendrons which have a dense tree-like canopy from above, but which are generally shorter than 3m in height. Rhododendron ponticom is a non-native invasive species.
Both CEH and DLT suffer from the well-known optical confusion between deep shadow and trees, which can be difficult to correct for. This manifests as landform shadows on moorland areas, around the northern edge of woodlands, and in east-west trending railway and motorway cuttings. Again, these errors will inflate the tree cover area to a degree.
In addition, because of the 10m resolution used by DLT and CEH, an over-estimate of tree cover will be produced because smaller holes in the canopy of woodlands will be smoothed over and counted as tree cover by CEH and DLT. The 1M2 resolution of the Friends of the Earth approach captures these small holes in the canopy.
On the other hand, because of the 10m resolution, DLT and CEH will under-estimate tree cover because they will not capture lone trees or small groups of trees.
The Friends of the Earth analysis is also likely to both over-estimate and under-estimate tree cover. For example, despite best efforts to remove false positives such as building edges that may appear treelike, or railway and motorway bridges, gantries and pylons, some false positives will persist.
In addition, the mapping is from a point in time, and trees lost to felling or disease since then will still be in the map.
But the map will have also missed some trees, for example pockets missed in the LIDAR data collection, the algorithm not recognising unusual trees or data processing by the Environment Agency (who supplied the LIDAR data). Small LiDAR shadows of missing data have been filled in using an interpolation from adjacent areas. Larger areas of missing data have been filled with National Forest Inventory data, but this will miss trees not in woodlands in this small number of areas.
Another dataset, UK Ward Canopy Cover, uses i-Tree canopy to randomly sample within wards to estimate canopy cover. A random sample may produce rather different result to an area-based method like the LiDAR map, depending on the spatial distribution of trees within a ward. Our data analysis is, we believe, more consistent than this approach but any estimate is not perfect.
Conclusion on methodology
Our map compares well with state-of-the-art optical satellite estimates from both Copernicus (DLT) and CEH and has the advantage of finer resolution and therefore can add the fine details of individual trees and small woods in both rural and urban areas.
All approaches have strengths and weaknesses, and none are 100% accurate or current. The datasets are however good enough to inform policy to address issues such as poor levels of tree cover in areas of deprivation, climate change adaptation, and local nature recovery strategies.