
Lisa Hopkinson and Lynn Sloman, Transport for Quality of Life 27 Jun 2019
Summary
The Department for Transport (DfT) has gone rogue on climate change. Transport is the only sector where greenhouse gas emissions have increased since 1990. A new analysis shows that the DfT's continued failure to curb emissions will lead to the UK breaching existing carbon budgets over the next decade, even before budgets are tightened on the pathway to net zero. Radical action to cut emissions from road transport and aviation over the next decade and beyond are needed. This will require DfT to constrain demand for road and air travel.
Introduction
This is an Annex to a series of papers commissioned by Friends of the Earth on the transport policies that are needed to cut carbon emissions in line with the Paris Agreement1. The series focusses on emissions from cars in urban areas as this is where significant and rapid carbon savings can be made while improving the quality of life for the 80% of people living in towns and cities. The first paper showed that we will need to reduce demand for car travel significantly, in addition to a rapid transition to electric vehicles, if we are to limit global warming to 1.5°C above pre-industrial levels2.
However as well as road transport we need to reduce carbon from all other transport sources, including international aviation and shipping (IAS). In the fifth paper in this series we highlighted the problem that there is no overarching assessment of carbon reduction showing how all transport carbon emissions will be cut, including IAS, in order to meet current climate targets, let alone Paris-aligned ones. This Annex discusses why a single carbon budget and reduction pathway is needed for the whole transport sector, now in the context of the Committee on Climate Change’s (CCC) new net zero report3. The briefing looks at the growing gap between domestic transport emissions and current targets, the particular problem of aviation emissions, estimates the gap for total transport and policy measures needed, and presents our conclusions and recommendations.
The growing gap between transport carbon emissions and targets
Current emissions from the whole transport sector
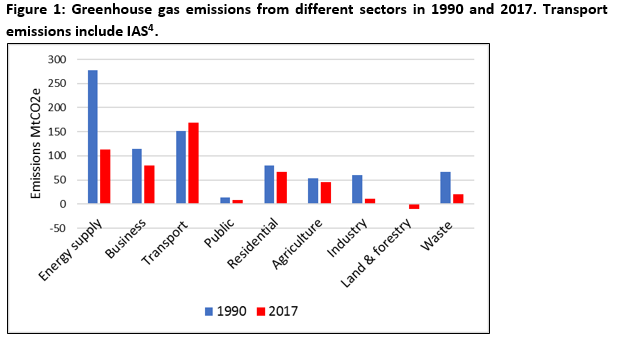
Transport is currently the UK’s worst performing sector for carbon reduction. Emissions from all other sectors (and the UK as a whole) have fallen since 1990, while total transport emissions (including IAS) have actually increased (see Figure 14).
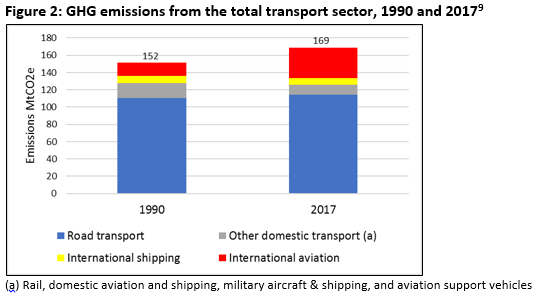
In 2017 the total transport sector (including IAS) accounted for over a third of total UK greenhouse gas emissions (34% by source or 37% by end user)5. While road transport accounts for the bulk of emissions from transport, aviation and shipping represent nearly a third of emissions6. Those from international aviation in particular have grown significantly, with levels in 2017 more than double 1990 levels7. Emissions from total transport have thus increased by 11% between 1990 and 2017 (Figure 2). This demonstrates the importance of having a single data series for total transport emissions rather than reporting IAS separately8, 9.
The growing gap between emissions and targets
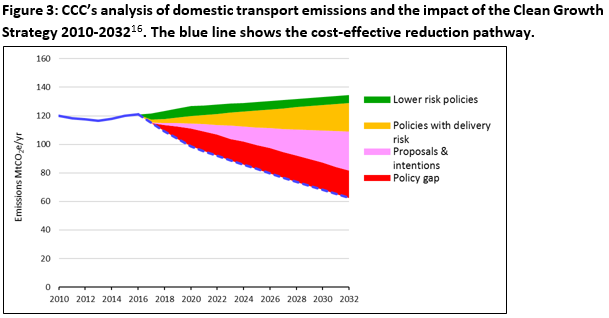
The Committee on Climate Change (CCC) have successively warned that without rapid action on domestic transport, the existing fourth and fifth carbon budgets (covering the periods 2023-2027 and 2028-2032 respectively) will be missed10. Even if all the current and proposed carbon reduction policies in the Clean Growth Strategy were implemented, the CCC have highlighted the large and growing ‘policy gap’ between forecast emissions for domestic transport (surface transport plus domestic aviation and shipping) and the cost-effective path to meet 2050 carbon targets11. Figure 3 shows the policy gap between forecast emissions and the cost-effective path for existing carbon budgets (the blue line). The policy gap could be even larger in practice as the analysis includes many policies ‘at high risk of delivery’12.
However it is important to note that the CCC’s analysis does not include IAS. While headroom of 41 MtCO2e for IAS is included in the UK’s target for 80% carbon reduction by 2050, IAS emissions have not been formally included in the CCC’s 5-year budgets thus far13. Instead up until now the budgets have been set to be consistent with the 2050 target taking into account the IAS headroom. Unlike other sectors there has never been a unified budget and reduction pathway for the whole transport sector which shows the emission reductions necessary to reach carbon targets, compared with Business-As-Usual (BAU) forecasts. It has been argued that this omission cannot be accidental14, 15.
Added to this the current carbon targets and budgets pre-date the Paris Climate Agreement16. The CCC have recently issued their advice that the UK should legislate for and reach a net-zero emissions goal by 2050, which should include IAS17. The government has recently proposed legislation for a net zero goal by 2050 but has yet to propose including IAS18.
The CCC’s inclusion of IAS in a reduced net zero budget is very welcome, but it also highlights the stark challenge we face. As the UK’s total carbon budget is reduced further to net zero, the total transport sector, and aviation in particular, will consume a growing share of the remaining budget. The CCC figures suggest that aviation alone, even if constrained to lower levels than currently targeted, could consume nearly three-fifths (57%) of residual emissions of a net zero carbon budget by 205019. This single industry will thus have a material impact on the ability of Government to meet its statutory carbon targets. Other advisors of the CCC have suggested that the assumptions for the aviation sector do not represent a fair share of the reductions required for net zero20.
The scope of the CCC’s net zero report did not include changes to the fourth and fifth carbon budgets, though some of its advisors recommend revisiting the targets for 203021. Yet even with no immediate changes to current budgets there is still a major shortfall in policy ambition and delivery for transport. When the fourth and fifth carbon budgets are revised this gap will be even greater. So far the poor and lagging performance of the transport sector as a whole has not been addressed by the Department for Transport (DfT) and requires urgent attention.
Different treatment for aviation and shipping
Why have IAS emissions not been included in carbon budgets?
The exclusion of IAS in the UK carbon budgets was originally due to the lack of an agreed and accurate way to allocate national responsibility for emissions22. By 2012 the CCC indicated that there was no longer any reason to account for emissions from IAS differently from other sectors23. However, the CCC’s recommendations to include IAS in budgets have been repeatedly rejected by government24.
The DfT has also made clear that it prefers IAS to be dealt with through the International Maritime Organisation (IMO)25 and the International Civil Aviation Authority (ICAO)26. However, there has been slow progress by both international bodies: an initial carbon reduction strategy for international shipping was only adopted by the IMO in 201827 and the ICAO only proposed a scheme to reduce emissions from international aviation in 201628. This scheme, known as CORSIA, which will be voluntary until 2027, has been severely criticised from many quarters as being woefully inadequate and based on discredited international offsetting schemes29, 30, 31.
In the latest net zero report the CCC has recommended legislating to include IAS in the 2050 target. Given that this does not preclude taking action through the ICAO and IMO, there is no reason for the government not to accept the CCC’s recommendation. However this should not bind the DfT’s hands in taking additional and more meaningful action to cut aviation emissions. The CCC has warned that should CORSIA not prove effective in reducing emissions the UK could pursue more robust standards through bilateral agreements32.
Although the CCC have recommended including IAS in budgets from 2033 onwards, without earlier action there is a risk that aviation will consume a dangerously disproportionate amount of future budgets. It is therefore important that IAS are included in revised budgets four and five to ensure the most cost-effective pathway for the whole economy before 2033.
Generous greenhouse gas targets for aviation
Since 2009 the aviation industry has been given a uniquely generous emission allowance in the CCC’s modelling. The CCC has never made clear the basis for this target though it can perhaps be traced to an aspirational target expressed by the aviation industry in 2008, equivalent to 32 MtCO2e by 205033. In 2008 the CCC also modelled a scenario based on the-then proposed emission cap for aviation in the EU-ETS, equivalent to 35 MtCO2e by 205034. The following year, the Government reiterated its support for a third runway at Heathrow, but said that this would be conditional on keeping national aviation CO2 emissions at or below 2005 levels by 2050 (ie 37.5 MtCO2e)35. In a 2009 report the CCC concluded that the government’s 2050 carbon target for aviation would be compatible with a 60% increase in passengers by 2050 compared to 200536.
The comparison to 2005 levels obscures the fact that this represents a more than doubling of emissions compared to 1990 levels (see Fig 4)37. This very generous 120% increase for the aviation industry contrasts with the 80%+ reduction in emissions for the UK as a whole. Furthermore this target does not restrict aviation exceeding that level throughout the period to 2050. Given that global temperature rises are determined by cumulative net carbon emissions this runs counter to the IPCC’s advice to reduce emissions as quickly as possible.
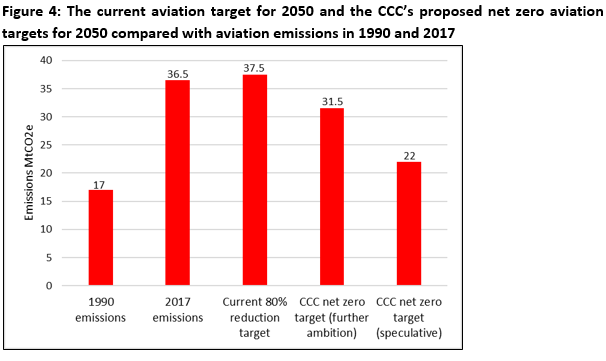
In its net zero report the CCC has maintained its somewhat arbitrary assumption that aviation demand be allowed to grow by 60% by 2050 relative to 200538. They advise that because of improved technology and efficiencies, emissions will be 20% lower by 2050 compared to 2005, i.e. 31.5 MtCO2e instead of 37.5 MtCO2e. However this new emission target still represents an 82% increase over 1990 levels (see Fig 4) and the CCC provide no real justification for maintaining growth at those levels. The CCC also raise the possibility that to meet the net zero target by 2050 further constraints on aviation demand to 20% above 2005 levels might be needed, which would reduce emissions to 22 MtCO2e39. Whatever target is adopted the DfT will need to constrain aviation emissions in future budgets accordingly.
Aviation non-carbon effects
While the current targets in UK climate legislation are expressed in terms of greenhouse gases as defined by the Kyoto Protocol (CO2e)40, aviation has specific non-CO2 impacts at high altitude that are not captured by this metric41, 42. These non-carbon effects are equivalent to a possible doubling of climate change impacts from CO2 alone43. The Government’s 2018 Aviation Green Paper recommends “to keep non CO2 emissions under review and reassess the UK’s policy position as more evidence becomes available”. However, despite the evidence that aviation’s non-carbon effects are significant (only the magnitude is uncertain), the government is taking no precautionary action to take account of these additional impacts. Instead it continues to press ahead with plans to expand airport capacity that will only increase aviation’s emissions. In its net zero report the CCC does not factor these non-CO2 effects into the 2050 target but advise that the government develops a strategy to reduce the effects and suggest demand-side measures as a solution44. The government can no longer ignore this additional impact from aviation.
Is aviation on track to meet the targets?
Parliament’s 2018 decision to approve a new Northwest runway at Heathrow means aviation emissions are forecast to exceed both the previous and the latest 2050 targets, further depleting the remaining budget for other sectors45. As well as Heathrow DfT are supporting plans to increase capacity, or make use of existing spare capacity, at airports across the UK46. Thus emissions are forecast to significantly increase at East Midlands, Birmingham, Liverpool, Manchester and other regional airports47.
The government’s forecasts for aviation CO2 from various years show that none of the forecasts (including the baseline) are compatible with the CCC’s new proposed target of 31.5 MtCO2e by 2050 (see Fig 5). If plans for a new runway at Heathrow were to go ahead there would be need to be significant constraints on growth at all other airports48. If the CCC’s lower target for 2050 of 22 MtCO2e were adopted Heathrow with a new runway alone would consume almost all (92-100%) of the budget for aviation49. The forecasts also show DfT’s disregard for compliance with even the current 2050 target of 37.5 MtCO2e.50
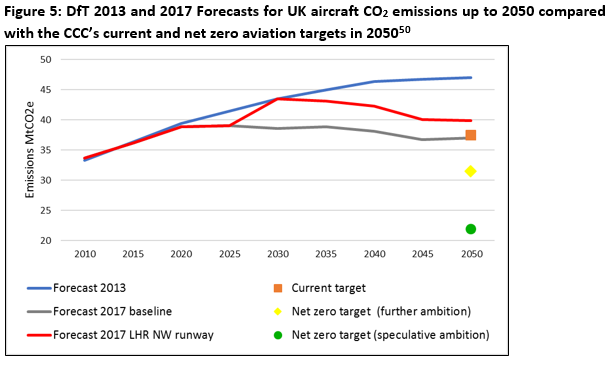
Doubts have been cast on the 2017 forecasts due to the ‘dramatic and poorly substantiated’ reduction in CO2 compared to previous ones51. These decidedly odd-looking reductions, which can be seen in Figure 5, appear to rely on hugely optimistic assumptions about technology improvements and passenger numbers per aircraft, requiring upwards of £120 billion investment 2020-204052. Despite this, emissions with or without a new Heathrow Northwest runway will remain above the new targets all the way up to 2050. This will result in a high risk of failure of reaching net zero by 2050, and is contrary to the stark warning by the IPCC that global emissions of CO2 must fall dramatically after 2020.
Why does the omission of IAS in budgets matter?
Since 2012 the CCC have expressed concern that the approach of leaving headroom for aviation emissions but not formally including them in carbon budgets lacked legal underpinning and risked creating uncertainties around the future interpretation of the 2050 target53, 54. This problem will hopefully be addressed by the government’s response to the CCC’s latest advice.
The omission of IAS in formal carbon budgets has led to several problems:
1. It has masked the fact that IAS, and international aviation in particular, has been given special treatment, with a generous emission allowance for the next 30 years. Aviation emissions have now been shown to account for a disproportionate amount of a net zero target. This special treatment fails to put sufficient pressure on the aviation industry to reduce emissions, and instead facilitates further airport expansion, leading to an even faster exhaustion of the remaining carbon budget. Although the rationale has always been that these are ‘hard to abate’ sectors, it has been suggested that there is a tendency to overestimate the costs of decarbonisation and once clear policy is set radical innovation is extremely likely even for ‘hard’ sectors such as aviation”55.
2. The over-generous carbon allowance for aviation in particular unfairly penalises other sectors since higher levels of aviation emissions will require deeper emissions cuts elsewhere. As one expert put it “Allowing 31 MtCO₂e of aviation emissions in 2050 stands out if most other sectors are required to reduce emissions to very low levels to achieve net zero.”56 Without more significant cuts to aviation the rest of the economy will need to make up the shortfall, leading to a much higher chance of the UK failing to meet its targets.
3. It means that surface transport and aviation emissions are treated in separate policy silos despite the fact that each heavily influences the other, with large amounts of road traffic generated by airport expansion or the use of surface transport investment to promote airport growth57.
These reasons alone should be sufficient to warrant the inclusion of IAS emissions in existing and future carbon budgets and fairer reduction targets, but their omission becomes untenable in light of the Paris agreement and the likely scale of the reductions needed to avoid the most catastrophic consequences of climate change.
The scale of the challenge to 2030
Forecast emissions for the whole transport sector by 2030
Transport as a whole accounts for a large and growing proportion of the UK’s carbon emissions. Reducing emissions over the next decade is critical due to the cumulative effect of emissions on global temperature rise. The CCC have advised there is a need to outperform the fourth and fifth budgets on the path to the net-zero target. However, it’s difficult to appreciate the scale of the challenge of reducing total transport emissions over the next decade (and beyond) due to the lack of a single unified dataset of forecast emissions (analogous to Figure 3). While the CCC’s fifth budget has separate forecasts for surface transport, aviation and shipping emissions in 2030, the forecasts do not identify which policy measures are included, and are likely to significantly underestimate future emissions58.
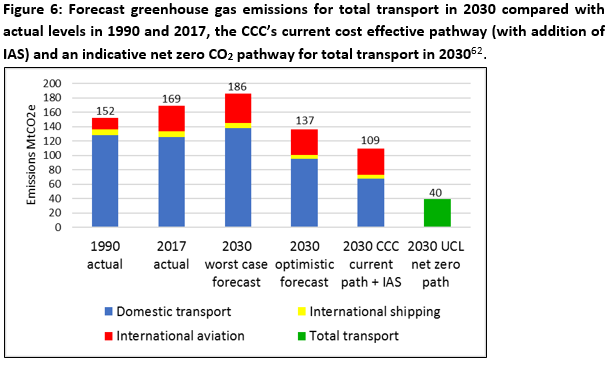
For illustrative purposes we have combined forecasts for domestic transport and IAS from different sources, adjusted for consistency, in Figure 6 below59. The higher ‘worst case’ forecast indicates possible emissions if domestic transport policy measures are not implemented (and remain as policy gaps), a new runway at Heathrow goes ahead and include ‘worst case’ shipping60 estimates. The lower ‘optimistic’ forecast indicates possible emissions if all domestic transport policy measures are implemented, a new runway at Heathrow is not built and include ‘best case’ shipping estimates. Note that some of the policies for domestic transport in the ‘optimistic’ forecast are judged by the CCC to have ‘significant risks of delivery’61. Figure 6 shows in the worst case forecast emissions could rise above current (2017) levels and in the optimistic forecast are only 10% lower than 1990 levels62.
Carbon reduction pathways for the total transport sector by 2030
Once there is a forecast of emissions for the total transport sector the CCC can develop a cost-effective reduction pathway towards the 2050 target which shows what reductions are needed over the next decade and beyond. However while there is a reduction pathway for domestic transport emissions up to 2032 from the fourth and fifth carbon budgets (see Figure 3) this does not include IAS and is not aligned with a net zero target. We need a net zero reduction pathway for total transport emissions for the fourth and fifth budget periods.
To give some idea of what a total transport pathway under the current 2050 target looks like, Figure 6 shows CCC’s current cost-effective reduction pathway for domestic transport in 2030 with the addition of the 2050 headroom for IAS63. Comparison with the forecasts for total transport for 2030 shows that even in the ‘optimistic’ forecast, total transport emissions will exceed the CCC’s current cost-effective pathway (with addition of IAS) by 2030. In the ‘worst case’ forecast total transport emissions would not only exceed the CCC’s current cost-effective pathway for transport but could be responsible for over half (56%) of the CCC’s current pathway for the entire UK economy in 203064.
Until the CCC revise the fourth and fifth budgets in 2020 we do not know what the net zero path for transport over the next decade will look like. In the absence of any CCC figures we have therefore shown in Figure 6 an indicative net zero pathway for total transport in 2030, based on a study by researchers at UCL65. This achieves net zero by 2045 and is likely to be more ambitious than the CCC’s 2030 net zero pathway66.
We do not know what the CCC’s revised cost-effective pathway for total transport will be by 2030. However, for the sake of argument we have assumed it is halfway between the current path of 109 MtCO2e and the more ambitious UCL net zero path of 40 MtCO2e, i.e. 75 MtCO2e, to test how feasible that would be. Assuming much more ambitious policy measures for road transport (over 90% of domestic transport emissions) including 20% reduction in road mileage, 100% of new cars to be electric and improvements in conventional car efficiency by 2030, this would leave around 30 MtCO2e of the budget in 2030 for IAS67. However, if there were lower levels of ambition on road transport then the budget for IAS would need to be even lower still. Finding any additional slack to cut in other sectors to compensate for aviation’s high and growing emissions is going to be increasingly difficult, as well as unfair. And this is before any account has been made of aviation’s non-CO2 effects which possibly double the impact.
While these are ballpark figures only, it is clear that simply freezing aviation emissions and targets at their current levels is not an option. DfT must bite the bullet and acknowledge that radical reductions in aviation emissions are needed over the next decade and beyond, probably below the CCC further ambition target of 31.5 MtCO2e. Depending on how effectively we reduce other transport emissions, and taking into account non-CO2 effects, this should probably be below the CCC’s speculative target of 22 MtCO2e.
Policy measures likely to be required
The previous papers in this series for Friends of the Earth have proposed a number of policy measures that can deliver the radical reductions in carbon emissions from cars (the bulk of road transport emissions) that will be required by 2030.
While the government’s recent proposal to enshrine net zero in law is a welcome step forward the government still needs to implement the CCC’s advice and legislate to formally include IAS in budgets, as well as ruling out the use of international offsets in budgets68. The current approach continues to leave headroom for IAS and is relying on discredited international offsets69. However, as the analysis above shows, to remain on the trajectory for net zero will almost certainly require reductions in aviation emissions. IAS needs to be included in budgets to avoid putting the net zero target in jeopardy, which will require additional legislation.
For aviation, as well as technology and efficiency improvements, it is clear that the government will need to constrain demand for air travel, to and from UK airports consistent with an emissions reduction pathway to net zero. The CCC have suggested carbon pricing, reforms to Air Passenger Duty, or policies to manage the use of airport capacity as measures to constrain the increase in passenger numbers to 20-60% of 2005 levels70. Additional measures that should be considered include an immediate halt on expansion of airport capacity and the introduction of pricing mechanisms such as a frequent flyer levy71 and removal of tax breaks on aviation fuel for domestic and EU flights72, 73. These would be fair and effective ways of limiting the disproportionate amount of air travel by a small proportion of people, with two thirds of flights from the UK made by less than 20% of people74. In the absence of proper carbon pricing any tax would also need to account for the disproportionate impact by class of flight and distance flown75. Government’s own analysis suggests that increased aviation taxation in the UK would be effective in reducing carbon76 while a leaked paper shows that European aviation is chronically undertaxed77.
Although this would impact on potential future jobs in the aviation sector it is worth noting that the rail sector employs three times as many people as the aviation sector78. A fairer tax package is likely to be highly cost effective. As well as generating additional revenue79, it could help close the gap between the money spent by British people holidaying abroad and that spent by overseas visitors in the UK: a trade deficit on tourism of around £20 billion in 201780. This would help to regenerate the economies of many seaside and rural areas of the UK.
Conclusions
The transport sector is the ‘rogue’ emissions sector and this needs to change. Forecast emissions for the total transport sector will exceed even the current cost effective pathway, let alone a lower net zero path by 2030. Continued failure to curb transport emissions means there is a risk that total transport emissions could exceed half of the total UK carbon budget in little more than a decade. To meet a likely net zero pathway by 2030 will require significantly higher levels of ambition to reduce road transport emissions as well as reductions in aviation emissions, possibly beyond that proposed by the CCC in their net zero report.
Specific actions needed include:
1. DfT should implement all possible measures for domestic transport, particularly road transport, to reduce the policy gap. This should include making all new cars electric, reducing total road mileage by 2030 by 20% and cancelling all new road schemes. See the Friends of the Earth briefings in this series on carbon and urban transport for more details.
2. Government should accept the CCC’s recommendations and legislate to include IAS in carbon budgets, rule out the use of international offsets for IAS in budgets, as well as developing a strategy to reduce the non-CO2 effects of aviation.
3. DfT should adopt as a minimum the CCC’s speculative aviation emission target of 22 MtCO2e or lower once non-CO2 effects are taken into account, to avoid aviation unfairly consuming the majority of residual emissions in 2050 and penalising other sectors. If IAS are not formally included in legislation then the headroom in budgets should be reduced accordingly.
4. Government should request the CCC to revise the fourth and fifth budgets as a matter of urgency, including IAS, to determine new emissions pathways and budgets for the total transport sector that are aligned with the net zero target.
5. DfT should review all possible policy measures and programmes at national, regional and local level to ensure delivery of the new targets and reduction pathways. This should include pricing and demand measures for all transport, including the measures to constrain aviation demand proposed by the CCC as well as a frequent flyer levy and removal of tax breaks on aviation fuel.
6. There should be an immediate halt on expansion of all new airport capacity until it can be demonstrated that any expansion is compatible with the new net zero target and revised budgets.
Acknowledgements
The authors would like to thank the following for help with information for this paper (in alphabetical order):
Cait Hewitt (Aviation Environment Federation), Tim Johnson (Aviation Environment Federation), Andrew Murphy (Transport and Environment), James Price (UCL Energy Institute, UCL), Steve Pye (UCL Energy Institute, UCL), Department for Transport Aviation Statistics
Thanks also to Ali Abbas, Jenny Bates, John Booth, Mike Childs, Richard Dyer, Gerald Kells, Brenda Pollock, and Anthony Rae for their helpful comments.
A PDF version of this briefing complete with hyperlinks is available on the Transport for Quality of Life website
- 1The papers in this series include (1) More than electric cars, (2) Transforming public transport, (3) Planning for less car use, (4) Segregated cycleways and e-bikes: the future of urban travel.
- 2We estimate car mileage will need to be reduced in the order of 20-60% by 2030 compared with 2016 levels, depending on a range of factors such as the rate of uptake of electric cars, improvements in conventional car emissions, and rate of decarbonisation of the power grid. However even if 100% new cars are electric by 2030 there will need to be significant reductions in mileage of all cars before then. Hopkinson L. and Sloman L. (2018) More than Electric Cars. Briefing for Friends of the Earth. February 2019.
- 3This report has recommended the inclusion of IAS in future carbon budgets at par of a total UK emissions reduction programme to reach net zero by 2050. They have recommended their inclusion from the first year of the sixth carbon budget (i.e. 2033).Committee on Climate Change (2019) Net-Zero - the UK’s contribution to stopping global warming. 2 May 2019.
- 4In 1990 total transport emissions were 151.8 MtCO2e and in 2017 were 168.7 MtCO2e an increase of 11%. Emissions from all other sectors combined fell by 50% from 666.3 MtCO2e to 334.3 MtCO2e. All data by source and including IAS. Department for Business, Energy and Industrial Strategy (BEIS) (2019). Final UK greenhouse gas emissions national statistics: 1990-2017. March 2019.
- 5In 2017 total transport emissions by source were 168.7 MtCO2e and by end user were 183.7 MtCO2e out of a total of 503 MtCO2e (all figures include IAS). When emissions are reported by source, emissions are attributed to the sector that emits them directly. When emissions are reported by end-user, emissions by source are reallocated in accordance with where the end-use activity occurred. End-user figures will be increasingly relevant as the number of electric vehicles on the roads increase. Department for Business, Energy and Industrial Strategy (BEIS) (2019). Final UK greenhouse gas emissions national statistics: 1990-2017. March 2019.
- 6In 2017 aviation accounted for 22% of total transport emissions (international aviation 35 MtCO2e and domestic aviation 1.5 MtCO2e) while shipping accounted for 8% (international shipping 7.8 MtCO2e and domestic shipping 5.9 MtCO2e) out of a total of 168.7 CO2e (all figures at source and total including IAS). Department for Business, Energy and Industrial Strategy (BEIS) (2019). Final UK greenhouse gas emissions national statistics: 1990-2017. March 2019.
- 7In 1990 greenhouse gas emissions from international aviation were 15.5 MtCO2e and in 2017 were 35.0 MtCO2e , an increase of 126%. These accounted for 96% of total aviation emissions of 36.5 MtCO2e in 2017. Department for Business, Energy and Industrial Strategy (BEIS) (2019). Final UK greenhouse gas emissions national statistics: 1990-2017. March 2019.
- 8An example of such a single data series can be found in Rae A. (2019) The threat of rising transport carbon emissions to the Climate Change Act process. Revised April 2019
- 9Department for Business, Energy and Industrial Strategy (BEIS) (2019). Final UK greenhouse gas emissions national statistics: 1990-2017. March 2019.
- 10The CCC’s 2016, 2017 and 2018 Progress Reports to Parliament have all warned of the lack of progress on transport and that the growing policy gap for domestic transport (the difference between forecast emissions and what is needed to meet carbon targets) must be urgently addressed. For example the fifth carbon budget highlights that the policy gap for transport could be as high as 60 MtCO2 by 2030 if high risk and medium risk policies do not deliver. Committee on Climate Change (2018) Reducing UK emissions – 2018 Progress Report to Parliament. 28 June 2018. In addition the starting point in 2017 is already 8 MtCO2 higher than anticipated in the fifth budget.
- 11Committee on Climate Change (2018) An Independent Assessment of the UK’s Clean Growth Strategy: From ambition to action. January 2018.
- 12The analysis shows that even with the implementation of all transport policies, proposals and intentions in the Clean Growth Strategy that the gap between domestic transport emissions and the cost effective path will increase from 12MtCO2e in 2020 to 19 MtCO2e by 2032. Committee on Climate Change (2018) An Independent Assessment of the UK’s Clean Growth Strategy: From ambition to action. January 2018.
- 13The statutory target for 2050 in the Climate Change Act is for net greenhouse gas emissions to be at least 80% lower than 1990 levels. At the time this meant a reduction from 797 MtCO2e to 160 MtCO2e by 2050 (both of which includes an allowance of 41 MtCO2e from IAS). Note that these historical levels for 1990 have been subsequently revised and increased slightly. In the fifth carbon budget the headroom for international aviation and shipping was 36 MtCO2e and 5 MtCO2e respectively (i.e. 41 MtCO2e combined).
- 14Rae A. (2019) The threat of rising transport carbon emissions to the Climate Change Act process. Revised April 2019.
- 15Rae A. (2019) If climate change targets can be enforced in the North, then why not everywhere? Viewpoint in Local Transport Today, 66, 15-28 February 2019.
- 16Committee on Climate Change (2018) An Independent Assessment of the UK’s Clean Growth Strategy: From ambition to action. January 2018.
- 17Committee on Climate Change (2019) Net-Zero - the UK’s contribution to stopping global warming. 2 May 2019. See recommendations on p257.
- 18On 12 June 2019 the government proposed The Climate Change Act 2008 (2050 Target Amendment) Order 2019, a Statutory Instrument which would amend Section 1 of the Climate Change Act so that the target is for net zero greenhouse gas emissions. At the time of this report this had still to be approved by Parliament.
- 19Figure 5.5 of the report shows aviation emissions of 31.5 MtCO2e out of a total of around 90 MtCO2e of residual emissions by 2050. There is also -55.5 MtCO2e of negative emissions, mainly engineered removals. Therefore to reach net zero will require additional reductions of around 35 MtCO2e. If aviation emissions are reduced to 22 MtCO2e (as part of the additional reductions required) they will account for 39% of the residual emissions (of 55 MtCO2e) but if aviation emissions remain at the proposed target of 31.5 MtCO2e then they will account for 57% of residual emissions. Committee on Climate Change (2019) Net-Zero - the UK’s contribution to stopping global warming. 2 May 2019.
- 20They further state that “This reinforces a need to support low and zero carbon innovations in the aviation sector, and to explore how demand growth can be limited further so that it is below the CCC’s trajectory.” Watson J. (2019) UK Net-Zero Advisory Group to the Committee on Climate Change. Chair’s Final Report. April 2019.
- 21Betts P. (2019) Chair’s Summary Report of the International Advisory Group to the committee on Climate Change in Relation to its Work on the UK Long-Term Emissions Goal. April 2019.
- 22International shipping emissions were excluded from the first three carbon budgets because of methodological issues and uncertainties over the international framework. At the UK level, there was concern that bunker fuel was not a reliable way of estimating emissions, given that a significant amount of UK seaborne trade is transhipped via other EU ports where refuelling may take place. Also, there were complexities about allocating aviation emissions. While the CCC agreed that international aviation needed to be covered by an international agreement, the fact that aviation was intended to be included in the EU’s Emission Trading Scheme (EU ETS) from 2012, which would have covered all flights from, to and within the European Economic Area (EEA) and capped emissions at 2004-06 levels, meant that the CCC felt it was not essential to have international aviation included in UK budgets to ensure pressure for emissions reduction. CCC (2008) Building a low carbon economy. The UK’s contribution to tackling climate change. December 2008.
- 23For example, the CCC considered that the inclusion of aviation in the EU Emission Trading Scheme in January 2012 meant that it should be treated in the same way as other sectors.
- 24The CCC recommended formally including IAS in budgets two to four and recommended including IS in the 5th budget. Committee on Climate Change (2012) Scope of carbon budgets. Statutory advice on inclusion of international aviation and shipping. April 2012. Committee on Climate Change (2015) Advice on the fifth carbon budget. November 2015.
- 25House of Commons Energy and Climate Change Committee (2016) Setting the fifth carbon budget: Government Response to the Committee’s Fifth Report of Session 2015–16. July 2016.
- 26Most recently the aviation White Paper states: “The government recognises that international action is the first priority for tackling international aviation emissions.” The government has also stated that it proposes to negotiate for a long-term goal for international aviation through ICAO but will consider appropriate domestic action. Department for Transport (2018) Aviation 2050. The future of UK aviation. Consultation, December 2018.
- 27The IMO have adopted a target to halve global shipping emissions by 50% by 2050 compared with 2008 levels. IMO (2018) UN body adopts climate change strategy for shipping. Briefing 13 April 2018.
- 28In 2016, ICAO proposed a market-based mechanism, the Carbon Offsetting and Reduction Scheme for International Aviation (CORSIA). Under CORSIA, countries’ airlines are given allowances to emit carbon, and if they exceed their allowances then they must buy offsets from other sectors. CORSIA will introduce a pilot scheme in 2021, when participating airlines will have to purchase carbon credits for emissions above 2020 levels on certain routes. It will become mandatory in 2027. Hodgkinson D. and Johnson R. (2016). New UN Deal on Aviation Emissions Leaves much to be desired. The Conversation, 10 October 2016.
- 29Under CORSIA, airlines burning kerosene could have reduced obligations to buy carbon offsets simply because the refinery producing the oil was running on renewable electricity. Transport & Environment (2018) ‘Green’ fossil fuels to be allowed under latest weakening of UN aviation CO2 scheme. News release 2 July 2018.
- 30CORSIA was approved in June 2018 and proposed a reduction in international aviation emissions by 2050, largely based on carbon offsetting schemes. However, there are currently enough carbon offsets on the market to meet the projected demand for carbon offsets up to 2035. Pavlenko N. (2018) ICAO’s CORSIA scheme provides a weak nudge for in-sector carbon reductions. Blog for International Council on Clean Transportation, 6 August 2018.
- 31A damning study of UN carbon offset projects found that only 2% of projects had a high likelihood of delivering additional carbon reductions Transport & Environment (2017) EU publishes damning report of emissions offsets, calling into question EU’s aviation climate strategy. News release, 18 April 2017.
- 32See Box 4.2 of the report. Committee on Climate Change (2019) Net-Zero - the UK’s contribution to stopping global warming. 2 May 2019.
- 33The UK organisation Sustainable Aviation published a ‘CO2 roadmap’ that set out a vision for reducing UK aviation emissions back to 2000 levels (around 32 MtCO2) by 2050 through a combination of operational and technological efficiencies and the introduction of biofuels, while allowing for significant passenger growth. Sustainable Aviation (2008) Sustainable Aviation CO2 Roadmap. December 2008.
- 34In developing a possible UK path to an 80% reduction the CCC modelled a scenario in which emissions from international aviation remain at the proposed allocation under Phase 3 of the EU ETS (5% below the average level of emissions over the period 2004-2006). Based on the latest greenhouse gas statistics this would be equivalent to 35.1 MtCO2e. Committee on Climate Change (2008) Building a low-carbon economy – the UK’s contribution to tackling climate change. December 2008.
- 35Minister of State (Transport) (2009) Transport: infrastructure. Statement by Lord Adonis, Minister of State for Transport, 15 January 2009, Hansard.
- 36Committee on Climate Change (2009) Meeting the UK aviation target – options for reducing emissions to 2050. December 2009.
- 37In 1990 greenhouse gas emissions from UK aviation (domestic and international flights) were 17.0 million tonnes CO2eq. Unlike other sectors which have to reduce emissions by an average of 80% compared to 1990 levels, aviation is allowed to increase its emissions by a hugely generous 120%, to 37.5 million tonnes by 2050 (equivalent to its 2005 emission levels). Committee on Climate Change (2009) Meeting the UK aviation target – options for reducing emissions to 2050. December 2009.
- 38The CCC state that “Given a population that is anticipated to grow and rising incomes, some growth in demand is expected. However, this cannot be unfettered. We have maintained our previous assumption that demand grows by 60% relative to 2005 levels (25% relative to today) by 2050.” However they do not give any reason why demand was constrained at 60% above 2005 levels for the Further Ambition scenario, other than the fact this was the original assumption in 2009. Committee on Climate Change (2019) Net Zero Technical Report. 2 May 2019.
- 39The CCC state that reducing UK GHG emissions to net-zero by 2050 will require some of the ‘speculative options’. These include further constraints on demand for aviation to 40% or 20% above 2005 levels which would save 4-8 MtCO2e. Committee on Climate Change (2019) Net Zero Technical Report. 2 May 2019.
- 40This includes the greenhouse gases agreed by the Kyoto Protocol: carbon dioxide (CO2), methane (CH4), nitrous oxide (N2O), Hydrofluorocarbons (HFCs), perfluorocarbons (PFCs), and sulphur hexafluoride (SF6), and nitrogen trifluoride (NF3). World Resources Institute and WBCSD (2013) Greenhouse gas protocol. Required Greenhouse Gases in Inventories. February 2013.
- 41These include emissions of NOx and contrails (condensation trails) which have additional impacts on the heating of the planet. Azar C. and Johansson D.J.A. (2012) Valuing the non-CO2 climate impacts of aviation. Climatic Change, Volume 111, Issue 3–4, pp 559–579. April 2012.
- 42Lee D. (2018) The current state of scientific understanding of the non-CO2 effects of aviation on climate. Report for Department for Transport, December 2018.
- 43Lee D. S. (2018) International aviation and the Paris Agreement temperature goals. Report for Department for Transport, December 2018.
- 44Committee on Climate Change (2019) Net-Zero - the UK’s contribution to stopping global warming. 2 May 2019.
- 45The 2017 forecasts show total UK aviation emissions with a Heathrow Northwest runway of 39.9 MtCO2 by 2050 (central forecast). Department for Transport (2018) UK aviation forecasts 2017. October 2017. The DfT is also proposing that maximum use should be made of the substantial additional runway capacity at all the UK’s regional airports. Department for Transport (2018) Aviation strategy: making best use of existing runways. June 2018.
- 46A large number of regional airports have ambitious expansion plans. For example Manchester plans to increase passengers from 24 million (2016) to 45 million. Newcastle plans to increase from 5.4 million (2017) to 9.4 million in 2035. John Lennon plans to increase from 4.8 million in 2016 to 11 million by 2050. Bristol plans to increase passengers by 2 million a year. Despite this the government’s UK aviation forecasts 2017 predicts that with a new Heathrow Northwest runway regional airport emissions will remain constant at 2016 levels of 8 MtCO2 until 2030 but increase to 11.6 MtCO2 by 2050.
- 47Carbon dioxide emissions are forecast to increase between 2016 and 2050 at East Midlands by 151%, Birmingham by 74%, Liverpool by 48% and Manchester by 38% (for a scenario with a new Northwest runway at Heathrow). DfT (2017) UK aviation forecasts 2017 with additional data directly from DfT Aviation Statistics.
- 48With a new Northwest runway Heathrow is forecast to emit 20 MtCO2e, over 60% of the total target of 31.5 MtCO2e. All other airports were forecast to emit around 20 MtCO2e by 2050 meaning they would need to cut planned growth by nearly half to meet the aviation target.
- 49Heathrow is forecast to emit 20.3 MtCO2e by 2050 with a new Northwest runway (central forecast) or 22.2 MtCO2e (high forecast). DfT (2017) UK aviation forecasts 2017 Table 70.
- 50Detailed year by year data from the 2017 forecasts obtained directly from Department for Transport Aviation Statistics. Data for 2013 obtained from the DfT UK Aviation Forecast 2013. This only provides data for the ten year data points 2020, 2030, 2040 and 2050 therefore we have assumed a straight trajectory to obtain the datapoints for 2025, 2035 and 2045.
- 51AEF (2017) AEF response to consultation on revised draft Airport NPS. 19 December 2017.
- 52AEF (2017) AEF response to consultation on revised draft Airport NPS. 19 December 2017.
- 53CCC (2012) Scope of carbon budgets. Statutory advice on inclusion of international aviation and shipping. April 2012.
- 54They further state that “This reinforces a need to support low and zero carbon innovations in the aviation sector, and to explore how demand growth can be limited further so that it is below the CCC’s trajectory.” Watson J. (2019) UK Net-Zero Advisory Group to the Committee on Climate Change. Chair’s Final Report. April 2019.
- 55Betts P. (2019) Chair’s Summary Report of the International Advisory Group to the committee on Climate Change in Relation to its Work on the UK Long-Term Emissions Goal. April 2019.
- 56Watson J. (2019) UK Net-Zero Advisory Group to the Committee on Climate Change. Chair’s Final Report. April 2019.
- 57For example according to the Mayor of London the expansion of Heathrow is expected to result in at least 40,000 additional vehicles on the roads every day. The Road Investment Strategy phase 1 included funding for a number of schemes to improve strategic roads to airports such as M65 Junctions 6-8 (Manchester); M1 Junctions 23A-24 (East Midlands) and M42 Junction 6 (Birmingham). Other than Stansted, the majority of air passengers, especially at regional airports, travel to the airport by private transport. This ranged from 53% (London City) to 92% (East Midlands). Civil Aviation Authority (undated) CAA Passenger Survey Report 2017.
- 58In the fifth budget the CCC provided emission forecasts for surface transport (2015-2035) and for aviation and shipping (2015-2050) under low, central and high emission scenarios. The combined ‘high emission’ scenarios for surface transport, aviation and shipping gives a forecast for total transport emissions of 162.2 MtCO2e in 2015 and 155.3 MtCO2e in 2020 (ie a downwards trend). CCC (2015) Sectoral scenarios for the fifth carbon budget. Supporting charts and data for Chapter 5 Transport. November 2015. This compares with actual emissions for transport from Final UK greenhouse gas emissions national statistics: 1990-2017 of 165.1 MtCO2e in 2015, 168.2 MtCO2e in 2016 and 168.7 MtCO2e.in 2017 (i.e. a higher starting point and upwards trend).
- 59The CCC’s independent assessment of the UK’s Clean Growth Strategy provide forecasts for domestic transport emissions based on the 2017 provisional data tables. The government’s UK aviation forecasts 2017 are for total aviation and are for CO2 only. The CCC’s shipping forecasts include domestic shipping and are for CO2e based on the 2015 data tables. There is the added complication that statistical datasets of emissions from different years often revise historical data as a result of improved data and methodology. Thus the 2015 domestic shipping emissions in the 2017 data tables were 2.4 MtCO2e while in the 2018 data tables they were revised to 6.1 MtCO2e, an increase of over 150%.
- 60The CCC’s high emission scenario for shipping most closely matches the forecasts in a 2017 report for government which suggests emissions from domestic shipping will remain static between 2014 and 2035 due to competing factors in growth and efficiency cancelling each other out. Ricardo (2017) A review of the NAEI shipping emissions methodology. Report for BEIS, December 2017.
- 61CCC (2018) An independent assessment of the UK’s Clean Growth Strategy. Charts and Data Annex. January 2018.
- 62Domestic transport emission forecasts are taken from the CCC’s An independent assessment of the UK’s Clean Growth Strategy. The ‘worst case’ forecast is based on the current trajectory without policy measures and the ‘optimistic’ forecast is based on the current trajectory with all policy measures. International aviation forecasts are taken from the DfT’s UK aviation forecasts 2017 for total aviation emissions (see Table 36). The ‘worst case’ forecast is based on emissions with a new Northwest runway at Heathrow and the ‘optimistic’ forecast is based on baseline forecasts, both for IA only. International shipping forecasts are taken from the CCC’s Sectoral scenarios for the fifth carbon budget forecasts for total shipping emissions (Chap 5 Transport, Fig 5.6). The ‘worst case’ forecast is based on the high emission scenario and the ‘optimistic’ forecast is based on the low emission scenario, both for IS only. All forecast figures have been adjusted for actual emissions in 2017. The ‘2030 CCC current path + IAS’ is described in endnote 62 while the ‘2030 UCL net zero path’ is described in endnote 64. While the UCL net zero pathway is for CO2 rather than CO2e in practice 99% of transport emissions are CO2.
- 63The ‘2030 CCC current path + IAS’ in Figure 6 is based on the CCC’s cost-effective path for domestic transport in 2030 (68 MtCO2e) plus the 2050 headroom for IAS (41 MtCO2e). No headroom was allocated for international aviation and shipping in the fourth and fifth carbon budgets. Those budgets are set to be consistent with the 2050 target taking into account the IAS headroom. However it is worth noting that the CCC originally recommended formally including IAS in budgets two to four (years 2013-2027) at a rate of 31 MtCO2e and 9 MtCO2e respectively. Committee on Climate Change (2012) Scope of carbon budgets. Statutory advice on inclusion of international aviation and shipping. April 2012.
- 64Note these figures are for emissions by source. We estimate the ‘worst case’ total transport emissions for 2030 to be around 186 MtCO2e. The CCC’s cost effective path to 2050 for all domestic sectors is 294 MtCO2e by 2030, which together with an allowance of 41 MtCO2e for IAS makes a total of 335 MtCO2e for the whole economy i.e. Total transport is forecast to be 55.5% of the cost effective path for the whole economy.
- 65The net zero pathway shown in Figure 6 is based on data from a UCL study on the implications of a 2°C CO2 budget for the UK with the analysis of longer term pathways to achieve net zero. The study is based on a global carbon dioxide budget similar to the IPCC’s 1.5°C scenario. The study used a budget from the lower end of the IPCC AR5 Synthesis Report of 590 GtCO2 for warming of below 2°C (66% probability) which adjusting for emissions from 2015 to 2018 is equivalent to 470 GtCO2. This is somewhere between the global budget of 580 GtCO2 (50% probability) and 420 GtCO2 (66% probability) for maintaining global temperature rise to 1.5°C above pre industrial levels in the IPCC’s Special Report on 1.5. For the pathway shown here (a 590 equity scenario) global emissions were allocated on effort sharing principles of equity (per capita basis) so that the UK has a 0.8% share of global emissions. The lower emission scenario requires high annual reductions of about 9% per year to remain within the budget and assumes high levels of negative emissions technologies. This results in a pathway for total transport emissions of around 40 MtCO2e by 2030. Pye S. et. al. (2017) Achieving net-zero emissions through the reframing of UK national targets in the post-Paris Agreement era. Nature Energy, 2, 17024. DOI: 10.1038/nenergy.2017.245. Additional data Pye S. (2019) Personal communication by email. 16 April 2019.
- 66The UCL study modelled emissions up to 2100 and achieves net zero in 2045, whereas the CCC was a more detailed bottom-up model based on one year only. Both models included the need for net emissions technologies. The lower UCL scenario is at the limits of technical feasibility and would have higher near term costs than the CCC scenario. The UCL pathway was only enabled by a large demand response, implying lifestyle changes to reduce mobility demand, but did not scrutinise the feasibility of such a response. Instead the paper focused on implied trajectories based on the science-derived budget. It is also important to note that the UCL analysis assumed strong reductions between 2015-2020 of around 40-50 MtCO2 which will not materialise. This would result in a very steep reduction trajectory that the model may possibly not have been able to construct if it was started 5 years later than 2015. Pye S. (2019) Personal communication by email. 8 May 2019 and 22 May 2019.
- 67We have assumed a 20% cut in car mileage, 100% new cars are electric and conventional car efficiency has improved, to give a ballpark figure for car emissions of 17 MtCO2e by 2030. We have also assumed remaining road transport emissions can be cut to 50-60% of 2017 levels ie to 18-22 MtCO2e, and rail emissions can be reduced to 1 MtCO2e by 2030. We have assumed domestic shipping and domestic aviation emissions are similar to 2017 levels i.e. 5.9 MtCO2e and 1.5 MtCO2e respectively. This gives a ballpark figure for domestic transport emissions of 43-47 MtCO2e by 2030, a 65-68% reduction from 2017 levels. This compares to the CCC’s current cost effective pathway for domestic transport of 68 MtCO2e, a 49% reduction from 2017 levels. If a net zero pathway for total transport was 75 MtCO2e by 2030 this would leave around 28-32 MtCO2e for IAS. This represents a 25-35% reduction on current levels of 42.8 MtCO2e from IAS.
- 68To bring IAS formally into the budgets is a simple step requiring a separate Statutory Instrument (SI) under Section 30 of the Climate Change Act (CCA). The government should also bring forward a SI under Section 11 of the CCA to ensure that international offsets would not be used for the 4th, 5th and subsequent carbon budgets.
- 69Department for Business, Energy and Industrial Strategy (2019) Explanatory Memorandum to The Climate Change Act 2008 (2050 Target Amendment) Order 2019. June 2019.
- 70Committee on Climate Change (2019) Net-Zero - the UK’s contribution to stopping global warming. 2 May 2019.
- 71A Frequent Flyer Levy could help address the disproportionate impact from wealthy individuals who fly very frequently. The levy would be zero for the first return flight and increase progressively for each subsequent flight in each year (for example, one possible scenario is £20 for the second flight, £60 for the third, reaching £420 by the ninth flight A Free Ride website.
- 72There is nothing in international and EU regulations preventing a tax on aviation fuel for domestic flights and many countries, including the US, Japan, the Netherlands, Norway and Switzerland, already levy aviation fuel tax on domestic flights. Greater carbon emission reductions would be achieved if aviation fuel tax were applied on all flights within Europe, which is currently permitted within EU law. It is also possible in future for taxation to be introduced on a bilateral basis with non-EU countries. Transport & Environment (2018) Roadmap to decarbonising European aviation. October 2018.
- 73Friends of the Earth (2019) Aviation and Climate Change. Position Paper.
- 74Friends of the Earth (2019) Aviation and Climate Change. Position Paper.
- 75The CCC net zero report notes that the majority of aviation emissions are from long haul flights, while 80% flights are for leisure. The government aviation forecasts provide no detailed breakdown of aviation greenhouse gas emissions by type of flight, passenger or destination. However, the distance flown and class of seat has a disproportionate impact on emissions. For example a long haul passenger economy flight from London to Sydney will emit 303 kg CO2e, ten times that of a short haul passenger economy flight from London to Malaga of 30 kg CO2e. Similarly a first class long haul passenger will be responsible for 7 times the carbon emissions of an economy passenger on the same flight. Department for BEIS and Defra (2018) Government emission conversion factors for greenhouse gas company reporting 2018.
- 76The analysis showed that measures associated with passenger behaviour (i.e. increasing ticket prices) usually cause negative ‘carbon leakage’ i.e. a decrease in emissions from UK aviation is matched by a decrease in emissions from non-UK aviation. Dray L. et al. (2018) The Carbon Leakage and Competitiveness Impacts of Carbon Abatement Policy in Aviation. Report for the Department of Transport by Air Transportation Analytics Ltd and Clarity Ltd, November 2018.
- 77Transport and Environment (2019) Leaked study shows aviation in Europe undertaxed.May 2019.
- 78Two estimates within a few months of each other estimated the rail sector supports 600,000 jobs while the aviation sector supports 230,000. Oxford Economics (2018) The Economic Contribution of UK Rail. February 2018. And Bolton G. (2017) The key role of the aviation sector in the UK economy. December 2017.
- 79This could also raise an estimated £7 billion a year for the Exchequer by 2020. Devlin, S. and Bernick, S. (2015) Managing aviation passenger demand with a Frequent Flyer Levy. New Economics Foundation: UK.
- 80UK residents spent £44.8 billion on visits overseas in 2017 while overseas residents spent £24.5 billion on visits to the UK. Office of National Statistics (2018). Travel Trends 2017. July 2018.