
Lynn Sloman and Lisa Hopkinson, Transport for Quality of life 05 Apr 2019
Summary
Physical inactivity costs the UK £7.4 billion per year and is responsible for 1 in 6 deaths.
Boosting investment so that UK urban areas matched the proportion of journeys made by walking and cycling in the best European towns and cities would improve health and save lives.
More walking and cycling would also cut carbon pollution. In urban areas, around a third of carbon emissions from driving could be avoided if people were able to switch to walking and cycling. With the growing popularity of e-bikes, this proportion is likely to increase.
The advent of e-cargo bikes also offers the potential to reduce the number of vans on our roads, helping to tackle chronic congestion.
A £2 billion a year investment in cycling and walking sounds a lot, but it is a small amount compared to spending on new roads and it brings considerable savings in health costs.
Friends of the Earth is happy to endorse the recommendations in this paper, which was produced for us by Lynn Sloman and Lisa Hopkinson at Transport for Quality of Life.
Introduction
This is the fourth in a series of eight papers commissioned by Friends of the Earth on the transport policies that are needed to cut carbon emissions in line with the Paris Agreement.
The first paper showed that we will need to reduce demand for car travel significantly, in addition to a rapid transition to electric vehicles, if we are to limit global warming to 1.5°C above pre-industrial levels1.
This paper considers how policies and investment to increase cycling and walking could reduce car travel, particularly in urban areas where most people live and work.
It examines evidence on the proportion of car mileage that could potentially be walked or cycled; the wider benefits of strategies to increase active travel; what has been achieved, and how, in exemplar international cities and towns; progress in the UK; and changes to national and local policy that are necessary in order to substantially increase non-motorised travel in the UK.
The potential of cycling and walking to reduce carbon emissions
Carbon emissions from personal travel
Nationally, about a quarter (24%) of car driver trips are under two miles. More than half (56%) are under five miles. This suggests that there is potential for a substantial proportion of car driver trips to shift to walking or cycling2.
Nevertheless, these short car trips account for a relatively small proportion of total car mileage. Just 3% of car driver mileage in England is on trips of under two miles. 14% of car driver mileage (and 21% of car CO2) is on trips of under five miles3.
The small proportion of car mileage that is on trips of a length suitable for walking or cycling has led some experts to question the relevance of walking and cycling as part of a strategy to reduce carbon emissions4.
However, looking specifically at urban areas, the potential for walking and cycling to substitute for car mileage is very much greater.
Research by Transport for London (TfL) found that 68% of car trips by London residents are short enough to be made by bike, and do not involve transport of heavy items or form part of a succession of ‘non-cyclable’ trips5. TfL’s analysis suggests that every day 3.1 million car driver trips and 1.6 million car passenger trips by London residents have the potential to switch to cycling (or in some cases to walking).
Our own analysis of the dataset on which the TfL research is based suggests that this is equivalent to 27% of car driver mileage and 25% of car passenger mileage by London residents6.
If the larger carbon emissions from cold starts are taken into account, it is likely that more than a third of car CO2 emissions by London residents have the potential to be avoided by substituting driving by cycling or walking.
The picture in other urban areas is likely to be similar7.
This estimate does not take account of the added potential for electric bikes (e-bikes) to substitute for car driving8.
E-bike users typically cover greater distances than conventional cyclists. For example, a German study found that the average e-bike trip was 11.4km as against 7.1km for conventional bike trips9.
E-bikes appeal to people who might not be able to use a conventional bike because of age, health or poor fitness, or because they live in hilly areas.
For example, in the Netherlands, 81% of e-bike distance is ridden by those aged 50 or over10.
A UK survey of shared e-bike projects found that one in three e-bike riders had rarely or never cycled before taking part, suggesting that e-bikes have the potential to broaden the proportion of the population who cycle11.
Elsewhere in Europe, e-bikes are rapidly growing in popularity, such that they now make up 31% of bike sales in Belgium and the Netherlands, 29% in Austria and 19% in Germany.
If e-bikes were to become equally popular in the UK, the proportion of car mileage that could be substituted by cycling would be increased.
Another source of evidence on the potential for cycling to reduce carbon emissions is the Propensity to Cycle Tool (PCT)12.
This estimates cycling potential under different conditions and in different geographical areas. It includes two scenarios which are particularly relevant: a ‘Go Dutch’ scenario and an ‘E-bike’ scenario13.
Go Dutch represents ‘what would happen if English people were as likely as Dutch people to cycle a trip of a given distance and level of hilliness’ – in other words, it measures how much cycling there would be in England if we had the same infrastructure and cycling culture as the Netherlands.
The E-bike scenario is modelled as an extension of Go Dutch. It assesses how much more cycling would happen if e-bikes were widely available (i.e. taking account of the increased likelihood of e-cycling for longer and hillier trips).
The PCT has been used to predict how cycle-commuting patterns would change in the West Midlands under different scenarios. The pattern would be similar for other parts of the country, even largely rural regions characterised by small towns14.
In the Go Dutch scenario, the model predicts that 19% of commuters living in the West Midlands would cycle to work, while in the E-Bike scenario it predicts that 28% of West Midlands commuters would cycle to work.
This is broadly consistent with the London estimate of the proportion of car mileage that could be substituted.
The TfL and Propensity to Cycle Tool estimates of potential car mileage savings (and therefore carbon savings) from increased active travel do not take account of two further factors.
First, there is potential for a combination of bike + train (or tram) to replace longer trips that are currently made by car. This may be significant for commuter travel into city centres outside London and the south-east.
Second, if all new housing, retail and employment developments were located within urban areas (rather than in suburban or semi-rural locations as at present), journey lengths would be shorter and the proportion of trips that were cyclable or walkable would be greater.
Carbon emissions from transport for goods and services
There is also potential to reduce carbon emissions from non-personal travel by light goods vehicles (vans) in urban areas, through the use of electric cargo bikes.
E-cargo bikes can replace vans for a number of purposes including shopping home delivery; ‘last mile’ parcel delivery by couriers; food delivery; internal deliveries between local authority buildings; and visits by tradespeople using heavy tools or equipment (e.g. electricians, window cleaners).
E-cargo bikes combined with city centre transshipment centres and local micro-depots are now being used by logistics companies in Berlin, Hamburg, Nuremburg, Frankfurt, Utrecht, Cambridge and other cities15, 16
There is evidence that they are efficient and can speed up deliveries, because they are easier to park than vans and are able to take shorter, faster routes in congested urban areas17.
Vans account for about 15% of motorised vehicle miles in urban areas in Britain. European research has suggested that in large cities up to 25% of all traffic may be by delivery and service companies in vans, cars and lorries.
It is estimated that between 10% and 30% of trips by delivery and service companies have the potential to be replaced by e-cargo bikes.
Taken together, these figures suggest that there may be potential for up to about 1.5-7.5% of all traffic mileage in urban areas to be removed if e-cargo bikes took over from delivery and service vehicles for suitable trips18.
Wider benefits of walking and cycling
Physical inactivity is responsible for one in six deaths and costs the UK an estimated £7.4 billion per year, including £900 million to the NHS19.
A recent evidence review for Public Health England concluded that active travel i.e. walking and cycling has significant health benefits at the population level.
People who walk or cycle have a lower risk of premature mortality. Walking and cycling reduce the risk of a number of diseases, including cardiovascular disease, respiratory disease, some cancers and Type II diabetes20.
Walking has been described as the ‘nearest activity to perfect exercise’21
Walking and cycling also have positive effects on mental health and general wellbeing22. This may partly be because walk-friendly neighbourhoods are associated with more social interaction, a stronger sense of community and more social capita23.
This evidence has led the National Institute for Health and Care Excellence (NICE) to call for new and upgraded roads to prioritise pedestrians and cyclists over vehicles, in order to encourage people to walk and cycle more24.
Shifting some car trips in urban areas to walking or cycling also has the potential to reduce air pollution.
Modelling commissioned by Sustrans25 estimated that if cycling were doubled and walking increased (in line with the Government’s targets in its Cycling and Walking Investment Strategy), there would be air quality benefits worth £567 million per year. 830 premature deaths would be saved annually.
Research commissioned by Transport for London shows that investment in walking and cycling facilities increases the economic vitality of high streets and local town centres, leading to higher office and retail property rental values, lower retail vacancy rates and busier and more vibrant streets26, 27.
Modal shift to cycling as a result of provision of segregated cycle tracks28increases the carrying capacity of congested streets.
Cycleways in London can move 2.5 times as many people as a general traffic lane despite taking up half the road space. Corridors where road space has been converted to a Cycleway move 5% more people per hour after provision of the cycle route, compared to before29.
European towns and cities with high levels of walking and cycling
There are many examples of European towns and cities that have very high levels of walking and cycling.
In Amsterdam, 67% of all trips in the wider metropolitan area are by foot or cycle30; in Rotterdam / The Hague it is 68%31; Freiburg 63%32; Oldenburg 52%33; Copenhagen, 48%34; Berlin 44%35; Munich 44%36; and in Hamburg 40%37.
It’s sometimes assumed that these high levels of walking and cycling are simply part of the culture of Dutch, Danish and German cities, and that it is impossible for UK towns and cities (where combined mode share for walking plus cycling is typically about 29%38) to emulate them.
However, continental European cities have not always had such high levels of active travel. In particular, cycling was in steep decline in many continental cities between the 1950s and 1970s, as it was in the UK39.
Major policy changes in the 1970s and 1980s in the Netherlands, Denmark and Germany halted this decline, and then led to a substantial increase in cycling40.
Cycling mode share roughly tripled in Munich and roughly doubled in Freiburg, Berlin and Hamburg41, 42.
European towns and cities that are now exemplars for their high levels of walking and cycling have a number of features in common:
Political support - consistent political support for active travel, sustained over several decades (since the 1970s or 1980s)43, 44, 45 together with a willingness to make politically controversial decisions to reallocate road capacity and car parking where necessary46.
Expenditure - substantial expenditure on cycling infrastructure, services and facilities, typically between about £1047, 48 and £25-3549, 50 per capita per year. Expenditure on walking is additional to this but is not commonly reported.
Development of cycle paths - continuous development of a network of cycle paths that are physically separated from traffic51, 52, 53, combined with periodic investment in some very expensive infrastructure to complete missing links, such as cycle and pedestrian bridges or tunnels54.
Traffic calming - traffic calming and speed limits of 20mph or lower on 70-80% of the road network and large car-free pedestrian zones55.
Discouraging car use - strategies to discourage car use (e.g. restrictions on the amount of car parking) sitting alongside pro-walking and cycling policies56, 57, 58.
Land-use policies - land use policies that create a dense compact city footprint as opposed to suburban sprawl59, so most journeys can be made quickly by foot or by bike.
Although the lessons from these exemplar towns and cities are clear, climate change does not allow us the luxury of acting slowly. We will need to find a way to compress the 40-year timeframe within which they have built their cycle networks into about 15 years.
In this, we can learn from cities such as Seville in southern Spain. It had no culture of cycling but built 120km of segregated cycle paths from a standing start in four years from 2007 to 2011 at a cost of €11 per head per year.
The result of this, in a city that had been considered too hot to cycle was that cycle trips increased fivefold and cycling mode share increased from about 1-2% to about 6%60, 61. Taken together, walking and cycling mode share increased from 39% to 43%62 in just a few years, bringing it up to a level comparable with Berlin, Munich and Hamburg.
We also need to learn from recent developments in other continental cities.
Some cities like Copenhagen are now working with neighbouring municipalities to expand their cycle network for many miles beyond the main urban area63. Combined with the rise in ownership of e-bikes, this will enable people to cycle for longer journeys, with substantial carbon savings compared to driving.
Figure 1 below64 shows the Cycle Superhighway network that is under construction in the Capital Region of Denmark. It is projected onto a map of London to demonstrate its scale. If replicated in London it would extend as far as Watford, Potters Bar and the M25.
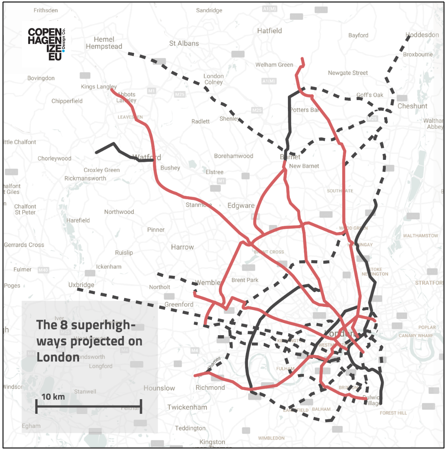
Figure 1: Cycle Superhighways in and around Copenhagen, projected onto London. Red lines show routes that were complete by mid-2017; black lines show routes that were planned and had funding; and dotted lines show routes that were planned but not funded at that time.
By the end of 2018, 167km of Cycle Superhighways had been finished in the municipalities around Copenhagen65. The entire network of 746km is expected to be complete by 2045 at a cost of €295 million.
This is less than a hundredth of the cost of building roads of the same length66.
Many of the Cycle Superhighways planned for the Capital Region of Denmark are through suburban or rural areas. Some routes link together pre-existing sections of cycle path, so the cost per km is probably lower than in a built-up area such as Greater London.
However, the cost may be comparable to that of building cycle paths alongside the UK trunk road network around cities outside London.
On the Danish Cycle Superhighway routes that have been completed so far, 25% of users previously drove. The average bike commute on one of the routes is 15km67.
UK towns and cities that are investing in walking and cycling
Compared to countries like the Netherlands, Denmark and Germany, political support for active travel is a relatively recent phenomenon in the UK.
However, London has shown strong support for walking and cycling over the last two decades. Since 2001, cycling has more than doubled (in a period when London’s population increased by only 20%)68.
Since 2016, London’s Healthy Streets Approach has prioritised investment in cycling and walking. The most recent business plan includes £2.3 billion for healthy streets over five years69equivalent to £57 per resident per year.
Transport for London’s new Cycling Action Plan commits to building more than 450km of high quality cycle routes by 2024, concentrated in places with most potential and strongest local political support70.
There is also strong support for walking and cycling in Greater Manchester. Mayor Andy Burnham has committed £160 million over four years71 (equivalent to £18 per capita per year from 2019/20) for the first stage in a longer-term £1.5 billion ten-year plan (i.e. an aspiration for £54 per capita per year) to build 120km of segregated cycle routes on main roads, and over 1,400 new or upgraded cycle and pedestrian crossings72.
Other cities that have benefitted from significant investment in walking and cycling in recent years, and that have seen growing levels of cycling, include Bristol, Cambridge, Brighton and Birmingham.
In Bristol, cycling expenditure has varied between £5-16 per capita per year in recent years73. In Cambridge, projects that are currently under development have a combined budget of about £31 million74(which, if funded over a five year period, would represent expenditure of about £50 per capita per year).
Across the UK, the picture is therefore of a few towns and cities with walking and cycling investment at comparable levels to the best towns and cities in Europe, but a large number of places where investment in cycling and walking is minimal (perhaps around £1-2 per capita per year).
In order to take advantage of the potential for walking and cycling to reduce carbon emissions, we need to find a way to spread the experience and enthusiasm of cities like London, Manchester and Bristol to all urban areas.
Changes to UK policy and practice to encourage a large shift to cycling and walking
Strategic action will be required in order to quickly achieve a significant shift from driving to active travel, with commensurate reductions in carbon emissions. International good practice and evidence from evaluations75 of cycling and walking investment in the UK suggest that we need:
Sustained investment - via 15 year Cycling and Walking Investment Deals between national and local government, quickly ramping up from an initial £10 to about £50 per capita per year.
Funding should be offered to all towns and cities that commit to employ permanent staff to deliver high quality cycling and walking infrastructure. This would break the pattern of the last 15 years of stop-start funding76, which makes it impossible for local authorities to develop their expertise.
If all urban areas signed a Cycling and Walking Investment Deal with government, the cost would ramp up to about £2 billion per year for England77, with additional funding needed for urban areas of Scotland, Wales and Northern Ireland.
Some funding might be routed via active travel non-governmental organisations such as Sustrans, Cycling UK and Living Streets, making use of their expertise, creativity and strong commitment78.
A mix of funding - A flexible mix of capital funding (for cycleways and pedestrian paths; secure under-cover cycle parking at major destinations and in residential areas; public bike hire schemes; traffic calming; pedestrian crossings; public realm schemes etc.) and revenue funding (for cycle training; bike loan or bike refurbishment schemes to provide low-cost bikes; community-led campaigns to encourage cycling among under-represented groups; travel behaviour change initiatives at schools, workplaces and universities etc.).
A new leadership body - leadership and support for local authorities, through a new body Walking and Cycling for England (with equivalents established by devolved governments elsewhere in the UK).
This body would foster knowledge-sharing, monitor progress and challenge local authority leaders where progress was slow.
It would also provide a not-for-profit design service to local authorities lacking in-house expertise, while they built that expertise up. It should be established by new legislation.
A flagship programme - strategic Cycleways Programme, initially in one Highways England Area, to build continuous segregated cycle and pedestrian paths adjacent to all single carriageway main roads for 15km either side of every settlement.
The aim should be to make all main roads as good as Danish main road cycle provision within five years.
Highways England should be repurposed (or replaced) and given a new aim79 to redress the historic under-investment in walking and cycling on the Strategic Road Network.
Once the Strategic Cycleways Programme is working effectively in the pilot area, it should be expanded nationally.
A Strategic Road Network Walking and Cycling Commissioner will be needed to hold Highways England or its successor body to account, as Highways England does not have a strong track record on cycling and walking.
Beneath these high-level strategic actions, a number of other national changes are needed. These include:
Action to stimulate the take-up of e-bikes - through grants towards the cost of purchase from the Office for Low Emission Vehicles (OLEV) and by offering e-bikes in return for scrappage of the oldest, most polluting cars.
There are national grants for e-bikes in Austria, France and Sweden, as well as numerous regional or local level grants programmes in Belgium, Germany, Italy, the Netherlands and Spain.
These grants have been highly effective in encouraging the take-up of e-bikes80.
Greater protection for cyclists - changes to the law to remove the danger experienced by pedestrians and cyclists, who make up more than half of all deaths on roads in built-up areas81.
There should be a 20mph speed limit on all built-up roads; effective enforcement of speed limits and road traffic law; changes to the Highway Code to require road users who are turning at junctions to give way to pedestrians and cyclists going straight ahead (as in Europe)82; and a direct vision standard for all heavy goods vehicles83.
Construction of cycle hubs - construction of cycle hubs at all main rail stations, offering secure cycle parking, bike hire, bike repairs and other cycle services; and provision of secure cycle parking at all smaller rail stations.
It is estimated that an additional 80,000 cycle parking spaces are needed at stations in Britain by the mid-2030s, simply to cater for underlying growth in rail travel84. This does not take account of increased demand as a result of action to encourage cycling within urban areas, or due to modal shift from car to bike + rail for commuter travel outside London.
The necessary increase in cycle parking at stations could therefore be substantially larger than this.
Cargo Bike Demonstration Cities - trials to shift freight in urban areas from vans to e-cargo bikes85. These would create transhipment centres and micro-depots for use by logistics companies; demonstrate and promote e-cargo bikes to businesses; offer grants towards the cost of e-cargo bikes; and switch public services (like parks maintenance and on-street collection of recycling) to e-cargo bikes.
Planning changes - changes to the planning system to ensure that new housing developments make walking and cycling easy and convenient.
For example, streets with modal filters which enable pedestrians and cyclists to take direct routes, but prevent cars rat-running; provision of key facilities such as shops, green space and primary healthcare within walkable distance; and promotion of car-free or car-club-only development86.
Conclusions
The following are Must Do actions on active travel to reduce transport carbon:
15 year Cycling and Walking Investment Deals between national and local government, quickly ramping up from an initial £10 to about £50 per capita per year, and including a flexible mix of capital funding and revenue funding.
A new body Walking and Cycling for England (with equivalents established by devolved governments elsewhere in the UK) to support and challenge local authorities to deliver excellent cycling and walking infrastructure and services.
A flagship Strategic Cycleways Programme to build continuous segregated cycle and pedestrian paths adjacent to all single carriageway main roads for 15km either side of every settlement.
A national e-bikes grants scheme, via the Office for Low Emission Vehicles (OLEV).
20mph speed limits on all built-up roads, effective enforcement of speed limits and road traffic law, a universal rule for road users to give way when turning, and universal introduction of a direct vision standard for heavy goods vehicles.
Cycle hubs at all main rail stations, offering secure cycle parking, bike hire, bike repairs and other cycle services; and secure cycle parking at smaller rail stations.
Cargo Bike Demonstration Cities: trials to shift freight in urban areas from vans to e-cargo bikes.
Acknowledgements
Thanks to Mike Childs, Chris Crean, John Booth, Jenny Bates, Gerald Kells, Richard Dyer, Haf Elgar, Kate Gordon, Matthew Snedker and Ric Bravery of Friends of the Earth, and Andy Cope of Sustrans, for their helpful comments and advice on this paper.
A PDF version of this briefing with full references including hyperlinks is available at the Transport for Quality of Life website.
- 1We estimate car mileage will need to be reduced in the order of 20-60% by 2030 compared with 2016 levels, depending on a range of factors such as the rate of uptake of electric cars, improvements in conventional car emissions, and rate of decarbonisation of the power grid. Hopkinson L. and Sloman L. (2019) More than Electric Cars: Why we need to reduce traffic to reach carbon targets. Briefing for Friends of the Earth. January 2019.
- 2Data is for England, from National Travel Survey NTS0308_2017.
- 3Department for Transport (2009) Low Carbon Transport: a Greener Future. A Carbon Reduction Strategy for Transport Figure 2.7. The difference between car driver mileage percentages and car CO2 percentages is due to the effect of cold starts. Although this report is now ten years old, the figures are likely still to be broadly correct. Car driver mileage data for 2017 in DfT statistics NTS0308 suggest 3% of car driver mileage is on trips of under two miles and 16% is on trips of under five miles.
- 4For example, Pooley C.G., Horton D., Scheldeman G. et al. (2012) Can increased walking and cycling really contribute to the reduction of transport-related carbon emissions? (Abstract only) In: Ryley T. and Chapman L. (eds.) Transport and Climate Change. Emerald. Bingley ISBN 978-1-78052-440-5.
- 5Transport for London (2017) Analysis of Cycling Potential.
- 6The TfL Analysis of Cycling Potential draws on data from the London Travel Demand Survey for the period 2012/13 – 2014/15. We used the same dataset to estimate total daily car driver and car passenger distance by London residents. We then estimated the distance travelled as part of ‘potentially cyclable’ car driver and car passenger trips using trip distance data from Figure 3.7 of TfL (2017) Analysis of Cycling Potential.
- 7However, note that estimates of the size of potential carbon savings depend on the assumptions made about which car trips are feasible to switch to walking or cycling. The TfL analysis of cycling potential assumes car trips up to 8km (for non-commute trips) or 10km (commuting) could be made by bike, and excludes trips that are part of a multi-trip chain or that involve carrying heavy loads. Another study (Neves and Brand 2018) assumed only car trips of up to 3 miles (i.e. 4.8km) were switchable, and excludes escort trips and shopping trips to large supermarkets as well as trips that are part of a multi-trip chain or that involve carrying heavy loads. These assumptions (which are acknowledged by Neves and Brand to be conservative) lead them to conclude that only 5% of car CO2 emissions could be saved by switching from car to cycling or walking. Our judgement is that although the Neves and Brand assumptions may give a ‘near term’ estimate of potential CO2 savings, they are unlikely to represent the full potential, especially given the likely increase in use of e-bikes. Neves A. and Brand C. (2018) Assessing the potential for carbon emissions savings from replacing short car trips with walking and cycling using a mixed GPS-travel diary approach. Transportation Research Part A Policy and Practice
- 8E-bikes are many times more energy-efficient than electric cars because they are so much lighter. Users still gain significant exercise benefit (because they still have to pedal) but the effort required to cycle uphill is much less.
- 9Newson C. (2019, awaiting publication) The case for a UK incentive for e-bikes: policy briefing. Report by Transport for Quality of Life for the Bicycle Association.
- 10Newson C. (2019, awaiting publication) The case for a UK incentive for e-bikes: policy briefing. Report by Transport for Quality of Life for the Bicycle Association.
- 11Newson C. (2019, awaiting publication) The case for a UK incentive for e-bikes: policy briefing. Report by Transport for Quality of Life for the Bicycle Association.
- 12Propensity to Cycle Tool https://www.pct.bike/
- 13Lovelace R., Goodman A., Aldred R., Berkoff N., Abbas A. and Woodcock J. (2017) The Propensity to Cycle Tool: an open source online system for sustainable transport planning . The Journal of Transport and Land Use 10(1) p505-528.
- 14For example, for Devon, the model predicts that 11% of commuters would cycle to work in the ‘Go Dutch’ scenario, and 22% would cycle to work in the ‘E-Bike’ scenario. Approximately a third of total commuter mileage would be travelled by bike in the ‘E-Bike’ scenario.
- 15Bicycle Association (2018) Response to DfT consultation “The last mile – a call for evidence” Response to DfT consultation “The last mile – a call for evidence” .
- 16Cairns S. and Sloman L. (2019, awaiting publication) Potential for (e-)cargo bikes to reduce congestion and pollution from vans in cities. Report by Transport for Quality of Life for the Bicycle Association.
- 17Cairns S. and Sloman L. (2019, awaiting publication) Potential for (e-)cargo bikes to reduce congestion and pollution from vans in cities. Report by Transport for Quality of Life for the Bicycle Association.
- 18Cairns S. and Sloman L. (2019, awaiting publication) Potential for (e-)cargo bikes to reduce congestion and pollution from vans in cities. Report by Transport for Quality of Life for the Bicycle Association.
- 19National Institute for Health and Care Excellence News Release, 4 January 2019, “New and upgraded roads should prioritise pedestrians, cyclists and public transport over motor vehicles”
- 20Public Health England (2018) Cycling and walking for individual and population health benefits: a rapid evidence review for health and care system decision-makers.
- 21Public Health England (2018) Cycling and walking for individual and population health benefits: a rapid evidence review for health and care system decision-makers quoting the eminent epidemiologist Professor Jeremy Morris.
- 22Public Health England (2018) Cycling and walking for individual and population health benefits: a rapid evidence review for health and care system decision-makers.
- 23Sinnett D., Williams K., Chatterjee K. and Cavill N. (2011) Making the case for investment in the walking environment: a review of the evidence. University of the West of England and Cavill Associates for Living Streets.
- 24National Institute for Health and Care Excellence News Release, 4 January 2019, “New and upgraded roads should prioritise pedestrians, cyclists and public transport over motor vehicles”
- 25Ballinger A., Chowdhury T., Cole G. and Jamieson O (2017) Air quality benefits of active travel Report by Eunomia for Sustrans
- 26Carmona M., Gabrieli T., Hickman R., Laopolou T. and Livingstone N (2018) Street appeal: the value of street improvements. Summary report by UCL for Transport for London.
- 27Transport for London (2018) Walking and cycling: the economic benefits.
- 28‘Segregated’ cycle tracks are cycle paths that are physically separated from traffic, for example by a kerb or a narrow verge. While segregation from traffic is preferred by all sociodemographic groups, those that are under-represented amongst cyclists (such as women and older people) express stronger preferences for segregation. Some studies have suggested that in order to increase participation in cycling in ‘low cycling’ countries like the UK, it is important to design the cycle network to reflect the preferences of these under-represented groups. See for example Aldred R., Elliott, B., Woodcock, J. and Goodman A. (2017) Cycling provision separated from motor traffic: a systematic review exploring whether stated preferences vary by gender and age. Transport Reviews 37(1), 29-55.
- 29Transport for London (2018) Segregated cycling infrastructure: understanding cycling levels, traffic impacts and public and business attitudes.
- 30EMTA (European Metropolitan Transport Authorities) (2018) Barometer 2016
- 31EMTA (European Metropolitan Transport Authorities) (2018) Barometer 2016
- 32ICLEI (2018) Case Study #210 December 2018: Freiburg im Breisgau, Germany: creating a liveable city through ecomobility.
- 33Federal Ministry of Transport and Digital Infrastructure, Germany (2012) The cycling mode share in cities.
- 34Kodukula, S., Rudolph, F., Jansen, U. and Amon, E. (2018) Living. Moving. Breathing. Wuppertal Institute.
- 35Buehler R., Pucher J., Gerike R. and Götschi T (2017) Reducing car dependence in the heart of Europe: lessons from Germany, Austria, and Switzerland. Transport Reviews, 37:1, 4-28.
- 36Buehler R., Pucher J., Gerike R. and Götschi T (2017) Reducing car dependence in the heart of Europe: lessons from Germany, Austria, and Switzerland. Transport Reviews, 37:1, 4-28.
- 37Buehler R., Pucher J., Gerike R. and Götschi T (2017) Reducing car dependence in the heart of Europe: lessons from Germany, Austria, and Switzerland. Transport Reviews, 37:1, 4-28.
- 38Active travel mode share in towns and cities in England was 29% in 2016/17, according to the National Travel Survey (table NTS9903). Some large cities undertake their own travel surveys, and these show similar results: 26% in London (London Travel Demand Survey 2017) and 28% in Greater Manchester (GM Travel Diary Surveys, TRADS, 2016
- 39Ministerie van Verkeer en Waterstaat (2009) Cycling in the Netherlands Figure 5.
- 40Goeverden K., Nielsen T., Harder H. and Nes R. (2015) Interventions in bicycle infrastructure, lessons from Dutch and Danish cases. Transportation Research Procedia 10, 403-412.
- 41Buehler R., Pucher J., Gerike R. and Götschi T (2017) Reducing car dependence in the heart of Europe: lessons from Germany, Austria, and Switzerland. Transport Reviews, 37:1, 4-28.
- 42ICLEI (2018) Case Study #210 December 2018: Freiburg im Breisgau, Germany: creating a liveable city through ecomobility.
- 43ICLEI (2018) Case Study #210 December 2018: Freiburg im Breisgau, Germany: creating a liveable city through ecomobility.
- 44Fietsberaad (2006) Continuous and integral: the cycling policies of Groningen and other European cycling cities.
- 45For example, city planner Troels Andersen in Odense, Denmark, commented in an interview with one of the authors that Odense had invested consistently in cycling for 40 years and this investment had turned a town where cycling was dying out (in the 1970s) into a town where everybody cycles.
- 46Dales J. and Jones P. (2014) International Cycling Infrastructure Best Practice Study. Report by Urban Movement and Phil Jones Associates for Transport for London.
- 47Clean Air and Soot Free for the Climate (undated) Guideline: Cycling – Cost-effective measures.
- 48City planner Troels Andersen in Odense, Denmark estimated that cycling expenditure was about £8 per resident per year, but with much higher expenditure in a period when a new cycle and pedestrian bridge was built. Consultant Manuel Calvo in Seville, Spain provided figures showing that cycling expenditure between 2007 and 2011 was about £8-9 per resident per year. Interviews with one of the authors.
- 49Government expenditure on cycling in the Netherlands was at least €487m in 2010, equivalent to expenditure per head per year of about £26: CROW Fietsberaad news release.
- 50The Copenhagen City of Cyclists Bicycle Account (2016) reports average expenditure on cycling of 295 DKK (about £35) per resident per year between 2004 and 2017.
- 51Buehler R., Pucher J., Gerike R. and Götschi T (2017) Reducing car dependence in the heart of Europe: lessons from Germany, Austria, and Switzerland. Transport Reviews, 37:1, 4-28.
- 52Federal Ministry of Transport and Digital Infrastructure, Germany (2012) The cycling mode share in cities.
- 53ICLEI (2018) Case Study #210 December 2018: Freiburg im Breisgau, Germany: creating a liveable city through ecomobility.
- 54For example, Troels Andersen, the city planner responsible for the cycle network in Odense, Denmark, has commented: “In Odense, much of the infrastructure that we need for cycling is built already. We have 540km of cycle paths. What we are doing now is building the missing links. Some of the missing links are extremely expensive – we’re building a bridge for cyclists which costs £17 million. But in a normal year we would spend £500,000 for revenue measures and £1 million for capital schemes.” Interview with one of the authors.
- 55Buehler R., Pucher J., Gerike R. and Götschi T (2017) Reducing car dependence in the heart of Europe: lessons from Germany, Austria, and Switzerland. Transport Reviews, 37:1, 4-28.
- 56Buehler R., Pucher J., Gerike R. and Götschi T (2017) Reducing car dependence in the heart of Europe: lessons from Germany, Austria, and Switzerland. Transport Reviews, 37:1, 4-28.
- 57Fietsberaad (2006) Continuous and integral: the cycling policies of Groningen and other European cycling cities.
- 58ICLEI (2018) Case Study #210 December 2018: Freiburg im Breisgau, Germany: creating a liveable city through ecomobility.
- 59Buehler R., Pucher J., Gerike R. and Götschi T (2017) Reducing car dependence in the heart of Europe: lessons from Germany, Austria, and Switzerland. Transport Reviews, 37:1, 4-28.
- 60Marques R., Garcia-Cebrian J. and Calvo-Salazar M. (2018) Seville: how a small Spanish city became a cycling hub for all. Euronews.
- 61Marques R., Hernandez-Herrador V., Calvo-Salazar M. and Garcia-Cebrian J (2015) How infrastructure can promote cycling in cities: lessons from Seville. Research in Transportation Economics 53, 31-44.
- 62Authors’ calculation based on data in Marques et al. (2015) How infrastructure can promote cycling in cities: lessons from Seville. Research in Transportation Economics 53, 31-44.
- 63Similar projects are also under discussion or starting to be implemented in Norway and the Netherlands. The Norwegian National Transport Plan for the period from 2018-2029 proposed building ‘bicycle express routes’ in nine urban areas. It describes these as ‘continuous cycle path[s] of high standard, facilitating fast and direct cycling over long distances’ and says that ‘this is a new form of investment in cycling infrastructure in Norway, and an important measure to make more people choose cycling instead of driving to work. Bicycle express routes will also make electric bicycles a more viable transport option.’ National Transport Plan 2018-2029 English Summary. In the Netherlands, the province of Gelderland is building ‘fast cycling routes’ between municipalities. On these routes (such as the 16km RijnWaalpad between Arnhem and Nijmegen), cyclists have priority at junctions with busy roads, and bicycle tunnels and bridges have been built under/over roads to minimise delays for cyclists Fast cycling routes Gelderland.
- 64Copenhagenize.com.Bicycle superhighways in Copenhagen
- 65Office for Cycle Superhighways (2018) Cycle Superhighways in the Capital Region of Denmark. (pdf)
- 66Five Cycle Superhighways built in 2017, with a total length of 115km, cost €20.7 million. An equivalent road length would cost €2.38 billion. Copenhagenize June 2017.
- 67Office for Cycle Superhighways (2018) Cycle Superhighways in the Capital Region of Denmark. (pdf)
- 68Indexed cycle journey stages in London increased from 2001=100% to 2017=225.7%. Travel in London Report 11 – data.
- 69Transport for London (2018) Business Plan 2018/19 to 2023/24.
- 70Transport for London (2018) Cycling action plan: making London the world’s best big city for cycling.
- 71£10m in 2018/19 and £50m per year thereafter for three years. Minutes of Greater Manchester Combined Authority 29 March 2018, item 16 Transforming Cities Fund.
- 72Transport for Greater Manchester (2018) Beelines: Greater Manchester’s cycling and walking infrastructure proposal.
- 73Personal communication with the authors.
- 74Personal communication with the authors.
- 75Relevant evaluations include: Sloman et al. (2009) Analysis and synthesis of evidence on the effects of investment in six Cycling Demonstration Towns; Hiblin (2010) Making a Cycling Town: a compilation of practitioners’ experiences from the CDT programme; Sloman et al. (2010) The effects of smarter choice programmes in the Sustainable Travel Towns; Sloman et al. (2017) Summary of outcomes of the Cycling Demonstration Towns and Cycling City and Towns programmes; Sloman et al. (2014) Finding the Optimum: revenue / capital investment balance for sustainable travel; Cairns et al. (2018) Sustainable Travel Towns: an evaluation of the longer term impacts; Sloman et al. (2018) Meta-analysis of outcomes of investment in the 12 Local Sustainable Transport Fund Large Projects; Hiblin et al. (2018) What Works? Learning from the Local Sustainable Transport Fund; Sloman et al. (2017, 2019) Cycle City Ambition Programme: Baseline and Interim Reports; Sustrans, Cavill and Davis (2019, awaiting publication) Active travel and physical activity evidence review: a report for Sport England.
- 76Since 2005, there have been a number of short-term 3-5 year competitively-funded cycling and walking programmes (Cycling Demonstration Towns, Local Sustainable Transport Fund, Access Fund and Cycle City Ambition), with gaps in between. Stop-start funding means that almost as soon as local authority officers know what they should be doing, the funding ends, they lose their jobs, and the local authority loses the expertise…so it is back to Square 1 when they win the next short-term grant.
- 77£2 billion per year in England assumes funding of £50 per capita per year for 42.6 million people living in urban areas with a Rural-Urban Classification of ‘urban’ (RUC3 or 4) or ‘conurbation’ (RUC5 or 6). The cost would be substantially offset by lower costs to the NHS due to more people being physically active.
- 78For example, Sustrans is the steward of the National Cycle Network and has recently completed a review of the NCN which estimates that £2.8 billion is needed over the next 22 years to make much more of the network traffic-free and to make it all of a good standard. The improvements that Sustrans is leading could help create Danish-style Cycle Superhighways between urban areas. The highly successful 13 mile Bristol-Bath Path, which inspired the creation of the NCN, now carries so many people that it has a rush hour. Sustrans (2018) Paths for everyone: Sustrans’ review of the National Cycle Network. Non-governmental organisations like Living Streets, Cycling UK and Sustrans played a significant role in delivering projects to encourage walking and cycling in partnership with local authorities as part of the £1 billion Local Sustainable Transport Fund between 2011 and 2015.
- 79Highways England’s aims and objectives are set for it by the Government in the Highways England Licence. The current aims make no reference to non-motorised users of the strategic road network. It’s also noteworthy that the aims set by the Licence require Highways England to ‘calculate and consider’ the carbon impacts of road projects, but make no reference to the need to reduce carbon emissions from traffic on the Strategic Road Network in order to meet the carbon budgets set by the Committee on Climate Change.
- 80Newson C. (2019, awaiting publication) The case for a UK incentive for e-bikes: policy briefing. Report by Transport for Quality of Life for the Bicycle Association.
- 81Department for Transport statistics table RAS30016.
- 82Chris Boardman has commented: “There are currently over a dozen different and often conflicting rules in the Highway Code which relate to people walking and cycling at junctions, so it is really no surprise that they continue to be the most dangerous places on our roads. In fact, a staggering two thirds of all traffic accidents take place at junctions and the story is even worse for cyclists, which is why our Turning the Corner proposals - backed by the AA and the RAC - called for a clear and universal rule to give way when turning.” Turning the Corner author explains campaign's aims and Boardman hails further progress for Turning the Corner campaign.
- 83Transport for London (2018) Vision Zero Action Plan includes a comprehensive appendix listing other changes to the law that are needed in order to reduce road danger.
- 84TRL (2015) Understanding the business case for investment in Cycle-Rail: demand modelling and cost-benefit analysis. Report for Department for Transport and Rail Safety and Standards Board.
- 85Bicycle Association (2018) Response to DfT consultation “The last mile – a call for evidence”.
- 86Necessary changes to planning policy are described in more detail in the third paper in this series, Planning for less car use.